/ Skip to main content

Food and Agriculture Institute

Food Asset Mapping

Project Description

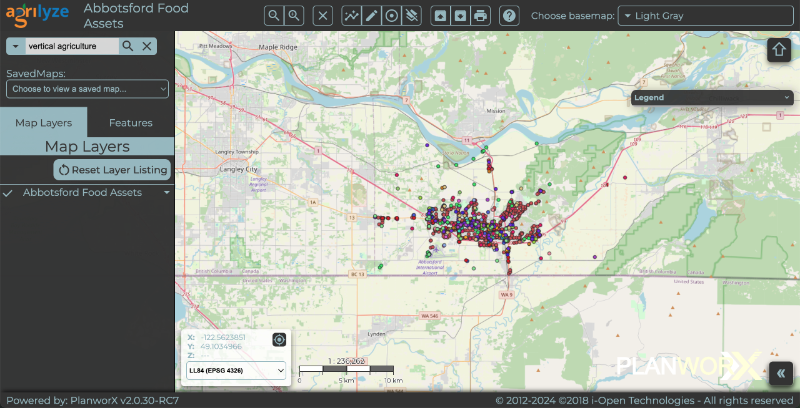
This project explored the use of maps as tools for improving food security and justice in Abbotsford. The Abbotsford Food Asset Map is a dataset created by mapping areas of high and low local food assets. By highlighting the locations of the local food assets this community tool will contribute to an understanding of where there may be interactions among vulnerabilities within the community. The Abbotsford Food Asset Map can be updated with new data as changes in the availability, locations, and accessibility of food assets occur within the city.

“Food assets are places where people can grow, prepare, share, buy, receive, or learn about food." - Vancouver Coastal Health


ACCESS MAP

 ABOUT MAP


How Does a User Navigate and Explore the Map?

The map has two sections:

  • Point of interest (POI) data: Turn on these layers to see individual points for the different food assets.
  • Data analytics: Turn on these layers to see choropleth maps that show concentrations of different types of food assets (the Combined Nutritional Asset layer combines Category 1, 2, and 5 from the table above). This section also contains demographic data map layers (i.e., Density Data) and housing and job security risk map layers (i. e., Risk) that can be displayed to compare with the food assets layers.

The Agrilyze platform has a number of features for exploring the maps:

  • Zoom: Use the zoom buttons or mouse scroll wheel to zoom in and out.
  • Turn on/off layer: Click the boxes next to the data layers to turn them on and off. 
  • Change data: Click on the name of a data layer to make a dropdown box appear, and use the dropdown box to change the data being displayed. Food asset layers can be displayed as total food assets, food assets per hectare, or food assets per person. Density can be displayed as population or dwelling density. Risks layers that can be displayed include housing and job security risks.
  • Opacity: Drag the slider to change the opacity/transparency of data layers.
  • Slider bar: Click the slider button to make a bar appear that hides/shows data when sliding back and forth.
  • Data table: Click the data table button to see more information about the different data points and polygons. Click the points and polygons on the map to see data for the specific point/polygon.
  • Zoom to layer: Click the zoom-to-layer button to move the map so that it focuses on that data layer.
How_to_Food Asset Map

Food Asset Framework

Category

     Description of Food Assets

1. Local food producers and retailers

  • Local growers with restaurants or farm stores
  • Fresh produce, CSAs, and drive-in farmstands
  • Farmers' markets and flea markets with food vendors

2. Nutritional food

  • Restaurants, not fast food
  • Locally-owned retail food/produce stores
  • Breweries/wineries with food menus
  • Cafes with food menus
  • Deli and butchers
  • Cafeterias
  • Food outlets
  • Bakeries

3. Limited nutrition

  • Fast food restaurants
  • Convenience stores,  chocolatiers, ice cream, vending machines

4. Community provision

  • Emergency food assets
  • Community meal programs

5. Community programs

  • Food-related school, nutrition, and community programs
  • Food action groups
  • Community gardens
6. Transit
  • Public transit stops


How Can the Map be Used for Food Security and Food Justice?


The Abbotsford Food Asset Map can be used to enhance food security and food justice in Abbotsford by highlighting locations of the local food assets. Comparing this map with other data, such as the housing and job insecurity maps, is useful for understanding where there may be interactions among vulnerabilities within the community.

It is important to identify areas where individuals and families are more likely to experience food insecurity within Abbotsford to support efforts toward strategically establishing and developing new assets and services. The Abbotsford Food Asset Map is a community tool that can be updated with new data, as changes in the availability, locations, and accessibility of food assets occur within the city.


Project Collaborators

Researchers

  • Alanna Clempson, Integrated Studies Student, University of the Fraser Valley
  • Robert Newell, Associate Director, Food and Agriculture Institute, University of the Fraser Valley

Advisors and Collaborators 

  • Taelyr Keeley, Supervisor of Food Justice, Archway Community Services
  • Matthew Brown, Community Health Specialist, Fraser Health Authority
  • Anne Todd, Project Leader, Healthy Living/Healthier Communities, Fraser Health Authority
  • Jonathan McIntyre, Cheif Technology Officer, i-Open Technologies Group
  • Jordi Solar, GIS Data Analysts, i-Open Technologies Group

Acknowledgements 

  • Val Crooks and the "Mapping the COVID-19 pandemic's secondary health impacts" research team, Simon Fraser University

FAI logo_white

 ‌Archway Community Services logo, colour Fraser Health Authority, logo, colour  i-Open Group, logo, colour

Contact Us